Health and Medicine Memory Infographic Template
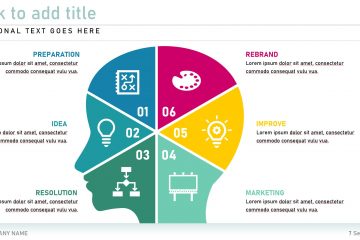
The Memory Infographic presentation template contains memory and brain related infographics to help you visualise medical or general information in your relevant proposal.
The Memory Infographic presentation template contains memory and brain related infographics to help you visualise medical or general information in your relevant proposal.
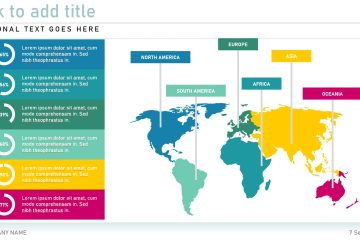
The World Maps Infographic presentation template contains several world map visuals that you can use to pinpoint specific locations or to add data to relevant areas on the map.
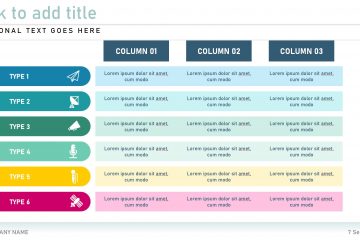
Table graphs are visual representations generally used to organise information to show patterns and relationships. Researchers and scientists often use tables and graphs to report findings from their research. Edit a diagram from the Table Graphs presentation template to fit in with your project.
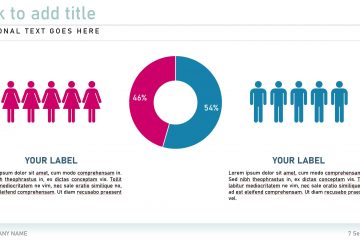
Pie charts are circular statistical graphics that are divided into slices to illustrate numerical proportion. The size of each ‘slice’ is proportional to the quantity it represents. Use an editable pie chart from the Pie Chart presentation template or draw inspiration from it to create your own.
Make education and learning a visual and fun experience by using editable elements from the Education and Learning Infographic presentation template to better illustrate complex ideas.
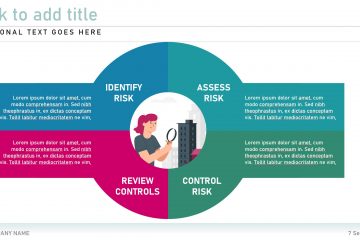
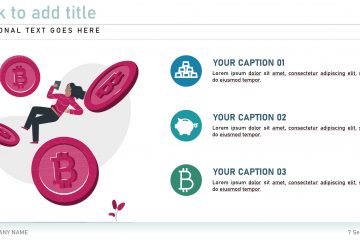
Risk management is the process of identifying assessing and controlling threats to an organisation’s capital and earnings. Visualise the proses in your next presentation by making use of a editable diagram or graphic from the Risk Management presentation template.
Use the Restaurant Startup presentation template to bring your restaurant or food service ideas to life. Include menu options and signature dishes to your presentation to show what will set your startup apart from the rest.
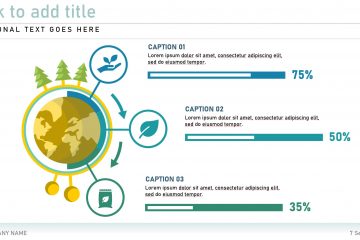
Use topic related infographics and diagrams to add flair to your next ecology or nature related project or business presentation. The Ecology and Nature Infographic presentation template contains a variety of editable diagrams to best communicate your green ideas.
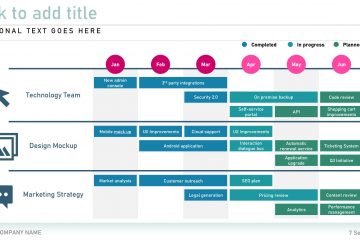
Edit a product roadmap diagram from the Product Roadmap presentation template to create a high-level visual summary that maps out the vision and direction of your product offering over time.
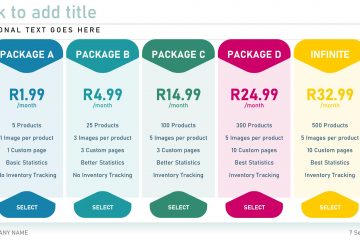
Pricing tables should communicate information clearly and precisely and expose as many features as possible to make it as easy and as intuitive as possible for a user to make the best choice when choosing a new product or service. Make your pricing table as informative as possible by using Read more…