Data Representation Pie Chart Template
About this template:
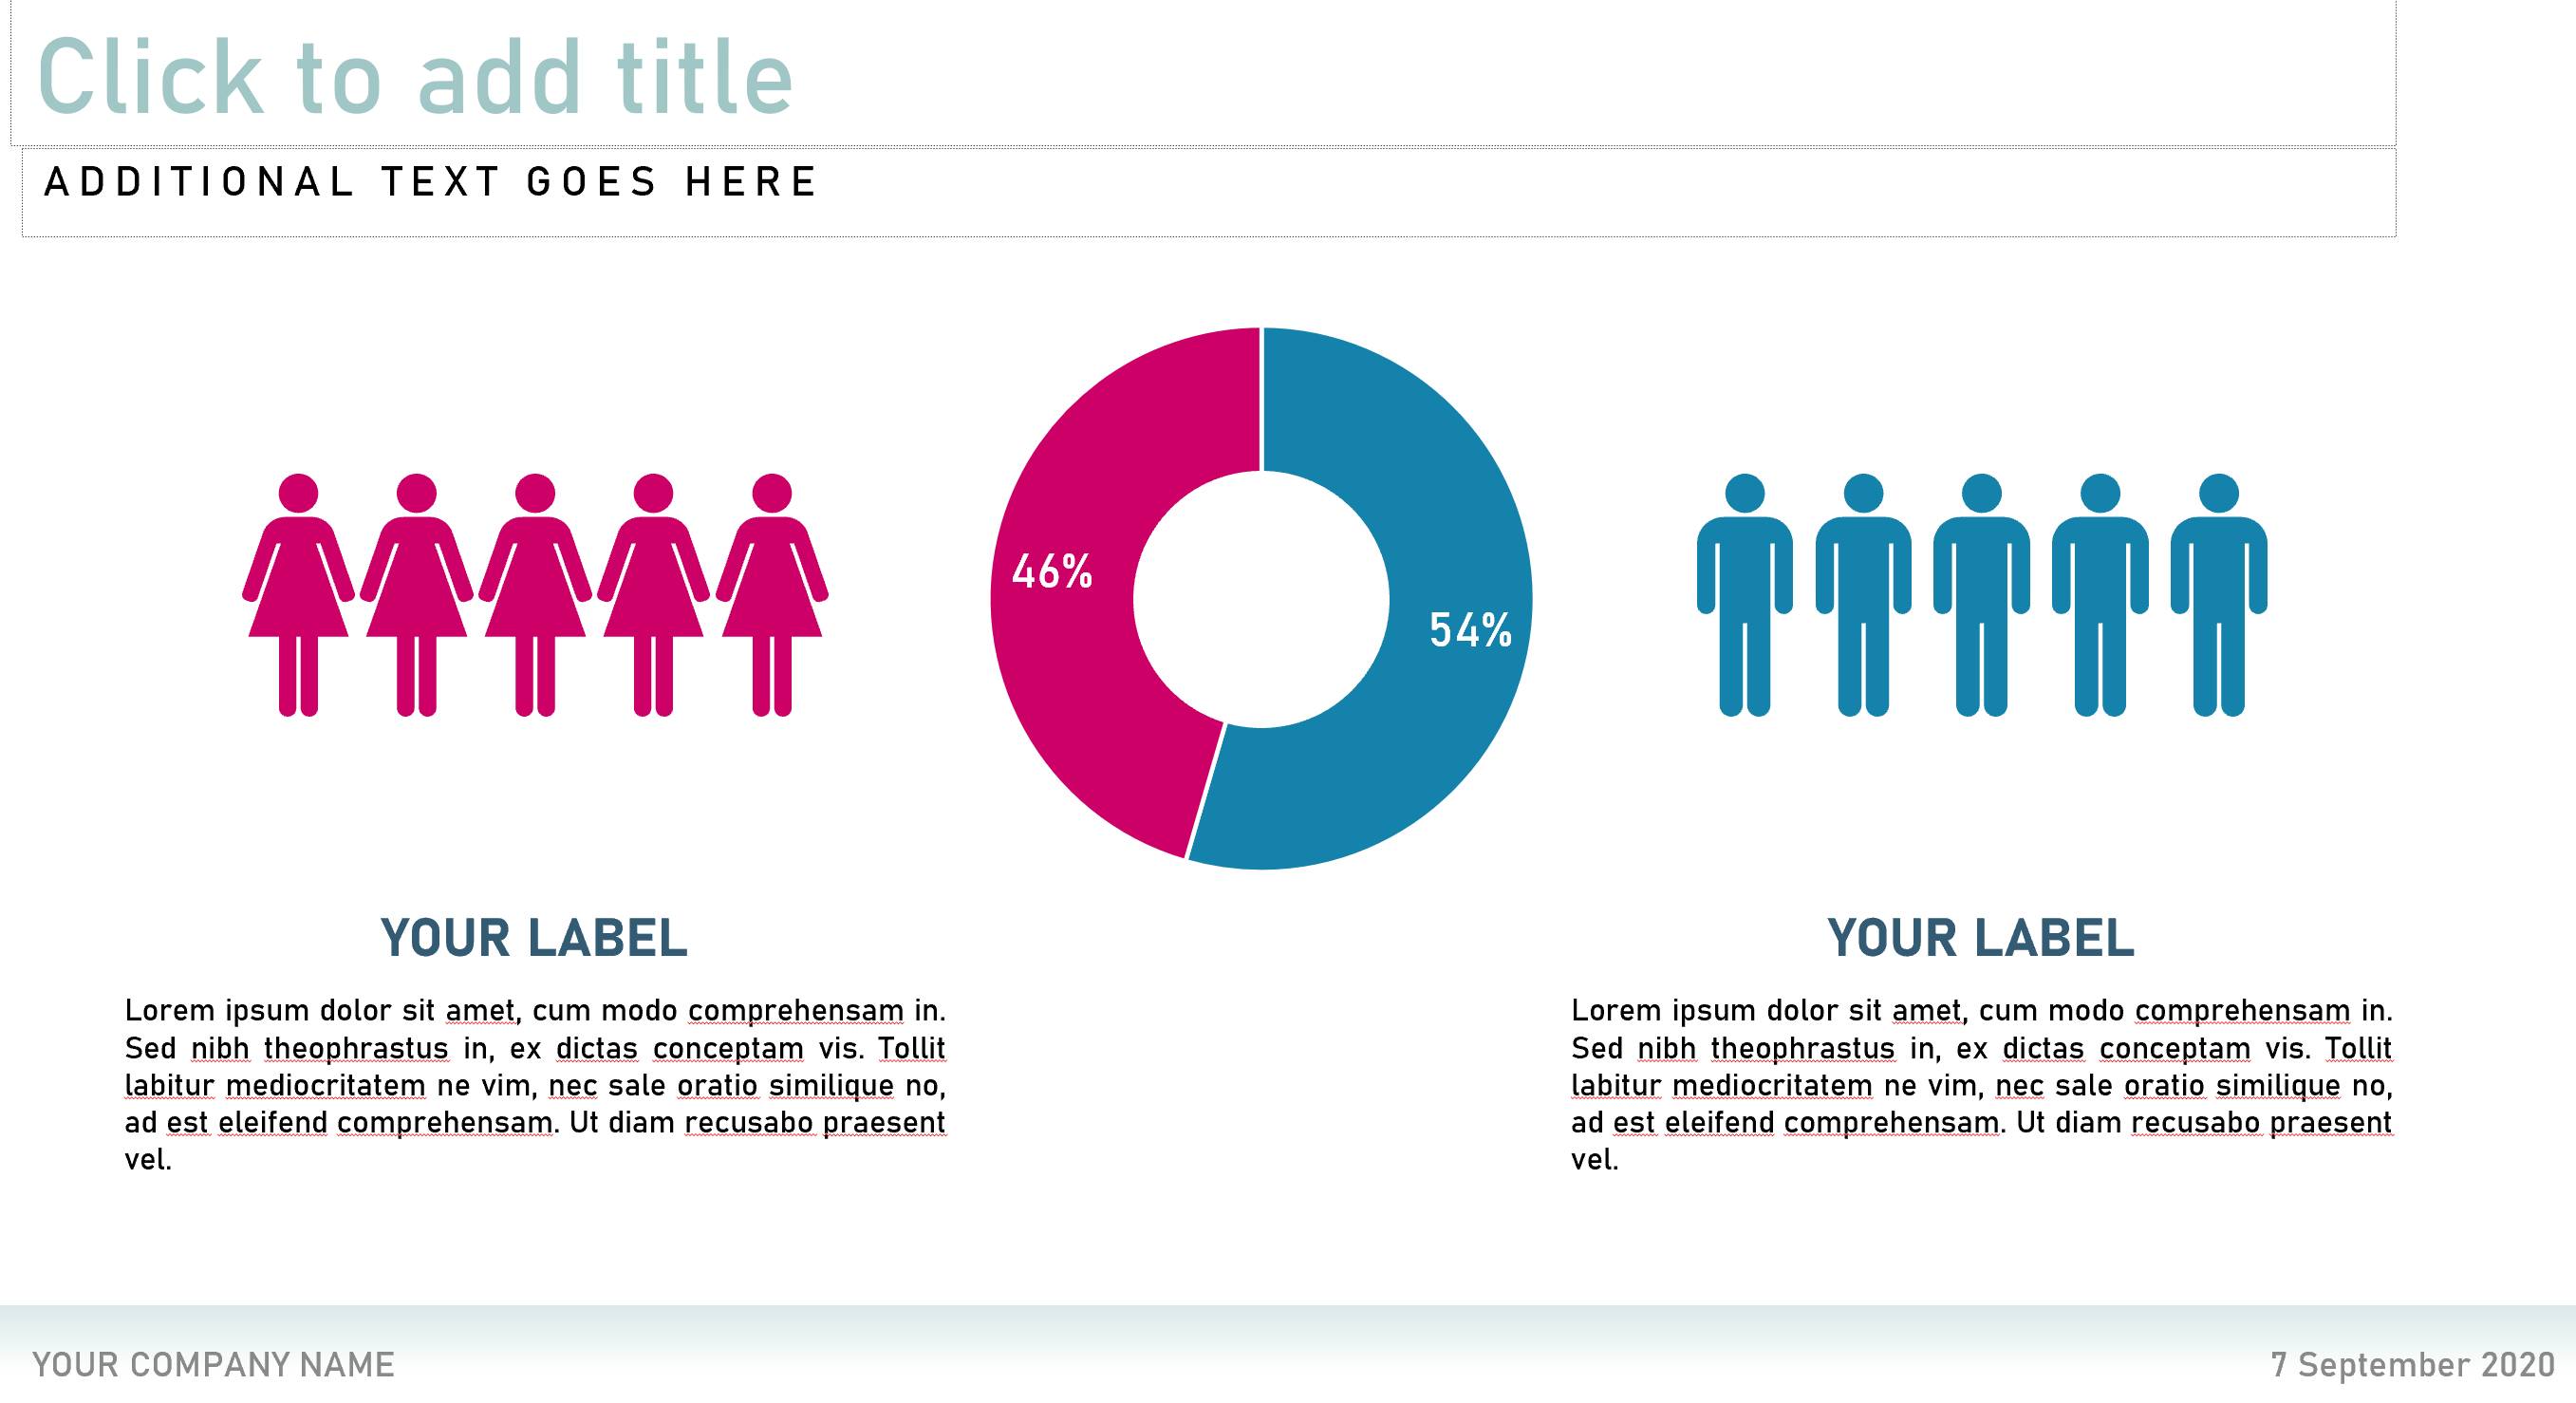
Pie charts are circular statistical graphics that are divided into slices to illustrate numerical proportion. The size of each 'slice' is proportional to the quantity it represents. Use an editable pie chart from the Pie Chart presentation template or draw inspiration from it to create your own.
Excerpt:
Download
| File | Action |
|---|---|
| Data Representation Pie Chart Template.pptx | Download |
| Data Representation Pie Chart Template.gslides | Download |
- Version
- 31 Download
- 1.40 MB File Size
- 2 File Count
- May 15, 2020 Create Date
- September 16, 2020 Last Updated
- Templateguru.org Source
- Download

0 Comments