Technology and Communication Marketing Infographic Template
The Marketing Infographic presentation template contains a variety of marketing and advertising-related infographic elements for you to edit and add to your next marketing pitch.
The Marketing Infographic presentation template contains a variety of marketing and advertising-related infographic elements for you to edit and add to your next marketing pitch.
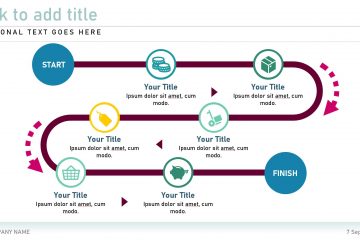
Find the right infographic elements to illustrate either the ongoing or the future route to success for your next project proposal or new business venture using editable elements from the Roadmap Infographic presentation template.
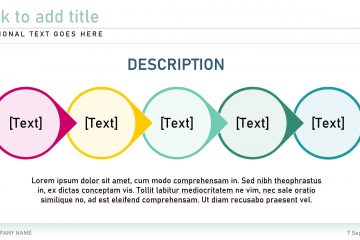
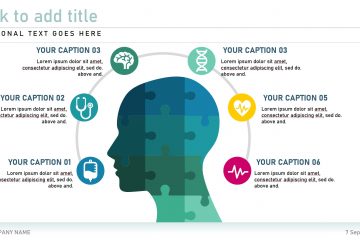
Smart graphics can be used to illustrate complex ideas in simpler visual-oriented diagrams and structures. All the elements in the Smart Graphics Infographic presentation template can be edited to suit your project and business needs.
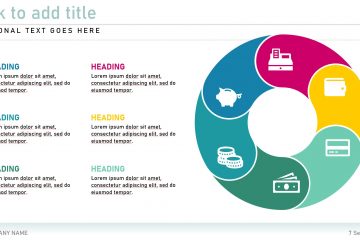
The fully editable Cycles Infographic presentation template was created to help you illustrate how different processes lead into and from one another to provide your business or project with a roadmap to success.
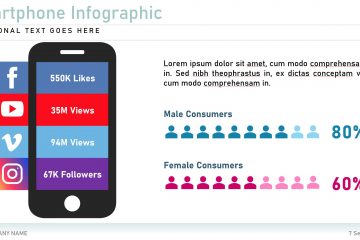
Facebook Twitter Youtube and more The Social Media Infographic presentation template contains social media-related infographic elements for you to edit and add to your next technology and communication or marketing pitch.
Use editable infographics from the General Infographic presentation template to add flair to your next health or medicine related proposal or presentation.
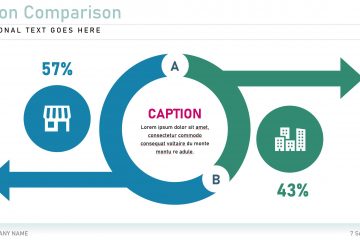
A comparison chart is a chart that draws a comparison between two or more items on based on different parameters related to the specific items. Use an editable diagram from the Comparison Charts Infographic presentation template to compare items in your proposal or presentation.
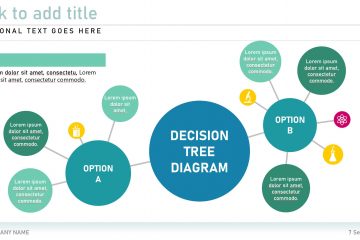
Decision trees are decision support tools that use a tree-like graph or model of decisions and their possible consequences including chance event outcomes resource costs and utility. Find your perfect editable problem-solving tree in the Decision Tree presentation template.
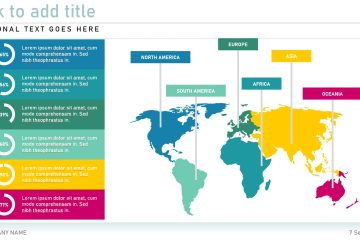
The World Maps Infographic presentation template contains several world map visuals that you can use to pinpoint specific locations or to add data to relevant areas on the map.
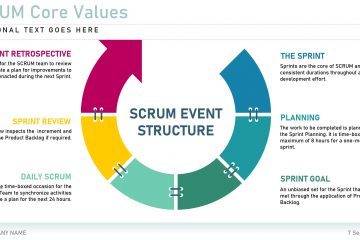
SCRUM is an agile approach to project management that breaks a product down into smaller tasks and places them on a list called a backlog. Tasks are taken from the backlog in the order they need to be completed and given to teams who work to get the job done Read more…