Business Concepts Human Resources Infographic Template
Effectively manage your company’s personnel and explore staff strengths and weaknesses by using elements and infographics from this fully editable Human Resources presentation template.
Effectively manage your company’s personnel and explore staff strengths and weaknesses by using elements and infographics from this fully editable Human Resources presentation template.
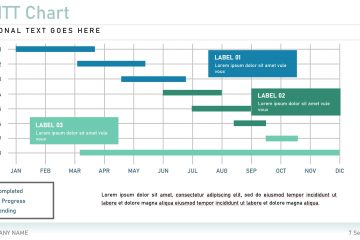
Gantt charts provide a graphical illustration of a schedule that helps to plan coordinate and monitor or track specific tasks in a project. Create yours by editing an existing diagram from the Gantt Chart presentation template.
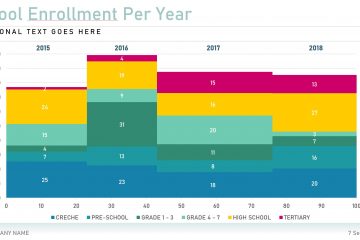
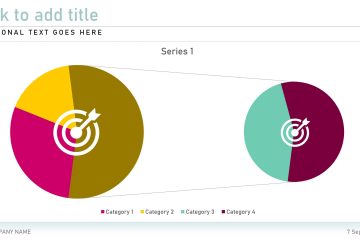
Use an editable diagram from the Mekko Chart presentation template to visualise categorical data over a pair of variables in your next business or project presentation. In a Mekko Chart both axes are variable with a percentage scale that determines both the width and height of each segment.
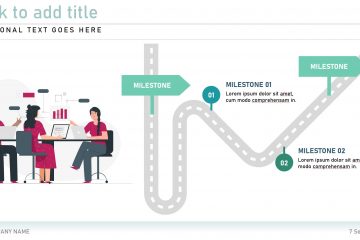
Find the right infographic elements to illustrate the route to success for your next project proposal or new business venture using editable elements from the Milestones Infographic presentation template.
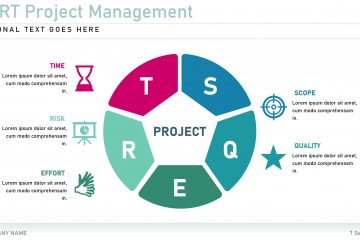
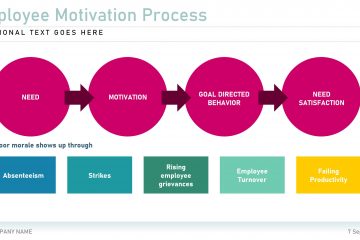
Project management is the way a person or business organises and manages resources that are necessary to complete a specific project. Use an editable diagram from the Project Management General presentation template to visually represent your own process.
The Diagram and Chart Varieties presentation template contains a variety of editable and inspirational diagrams and charts for you to customise and add to your next project or business proposal.
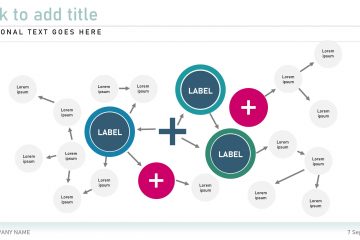
Systematise your thoughts and ideas by arranging them into a neat editable mind map from this Mind Map Infographic presentation template. Use icons and visuals to best present your ideas in your next proposal.
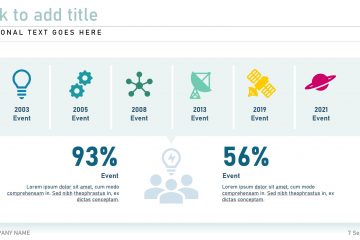
The Project Management Timeline presentation template will assist you in visually explaining the timelines that your business aim to meet in order to meet specific project goals and objectives.
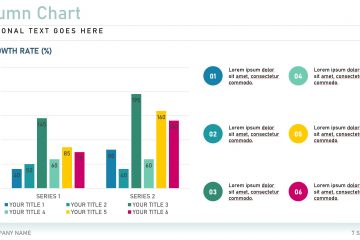
Use an editable bar graph or draw inspiration from the Bar Graph Statistics presentation template in order to illustrate comparisons between categories of data and information relevant to your business or project.
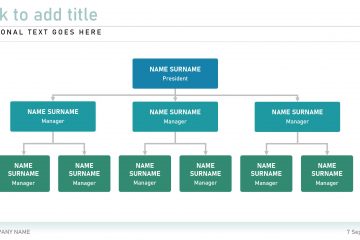
Organise and classify staff based on their ranks specific skills and knowledge by making use of a fully editable structural diagram from the Organisational Chart Infographic presentation template.