Data Visualisation Elements Comparison Charts Infographic Template
About this template:
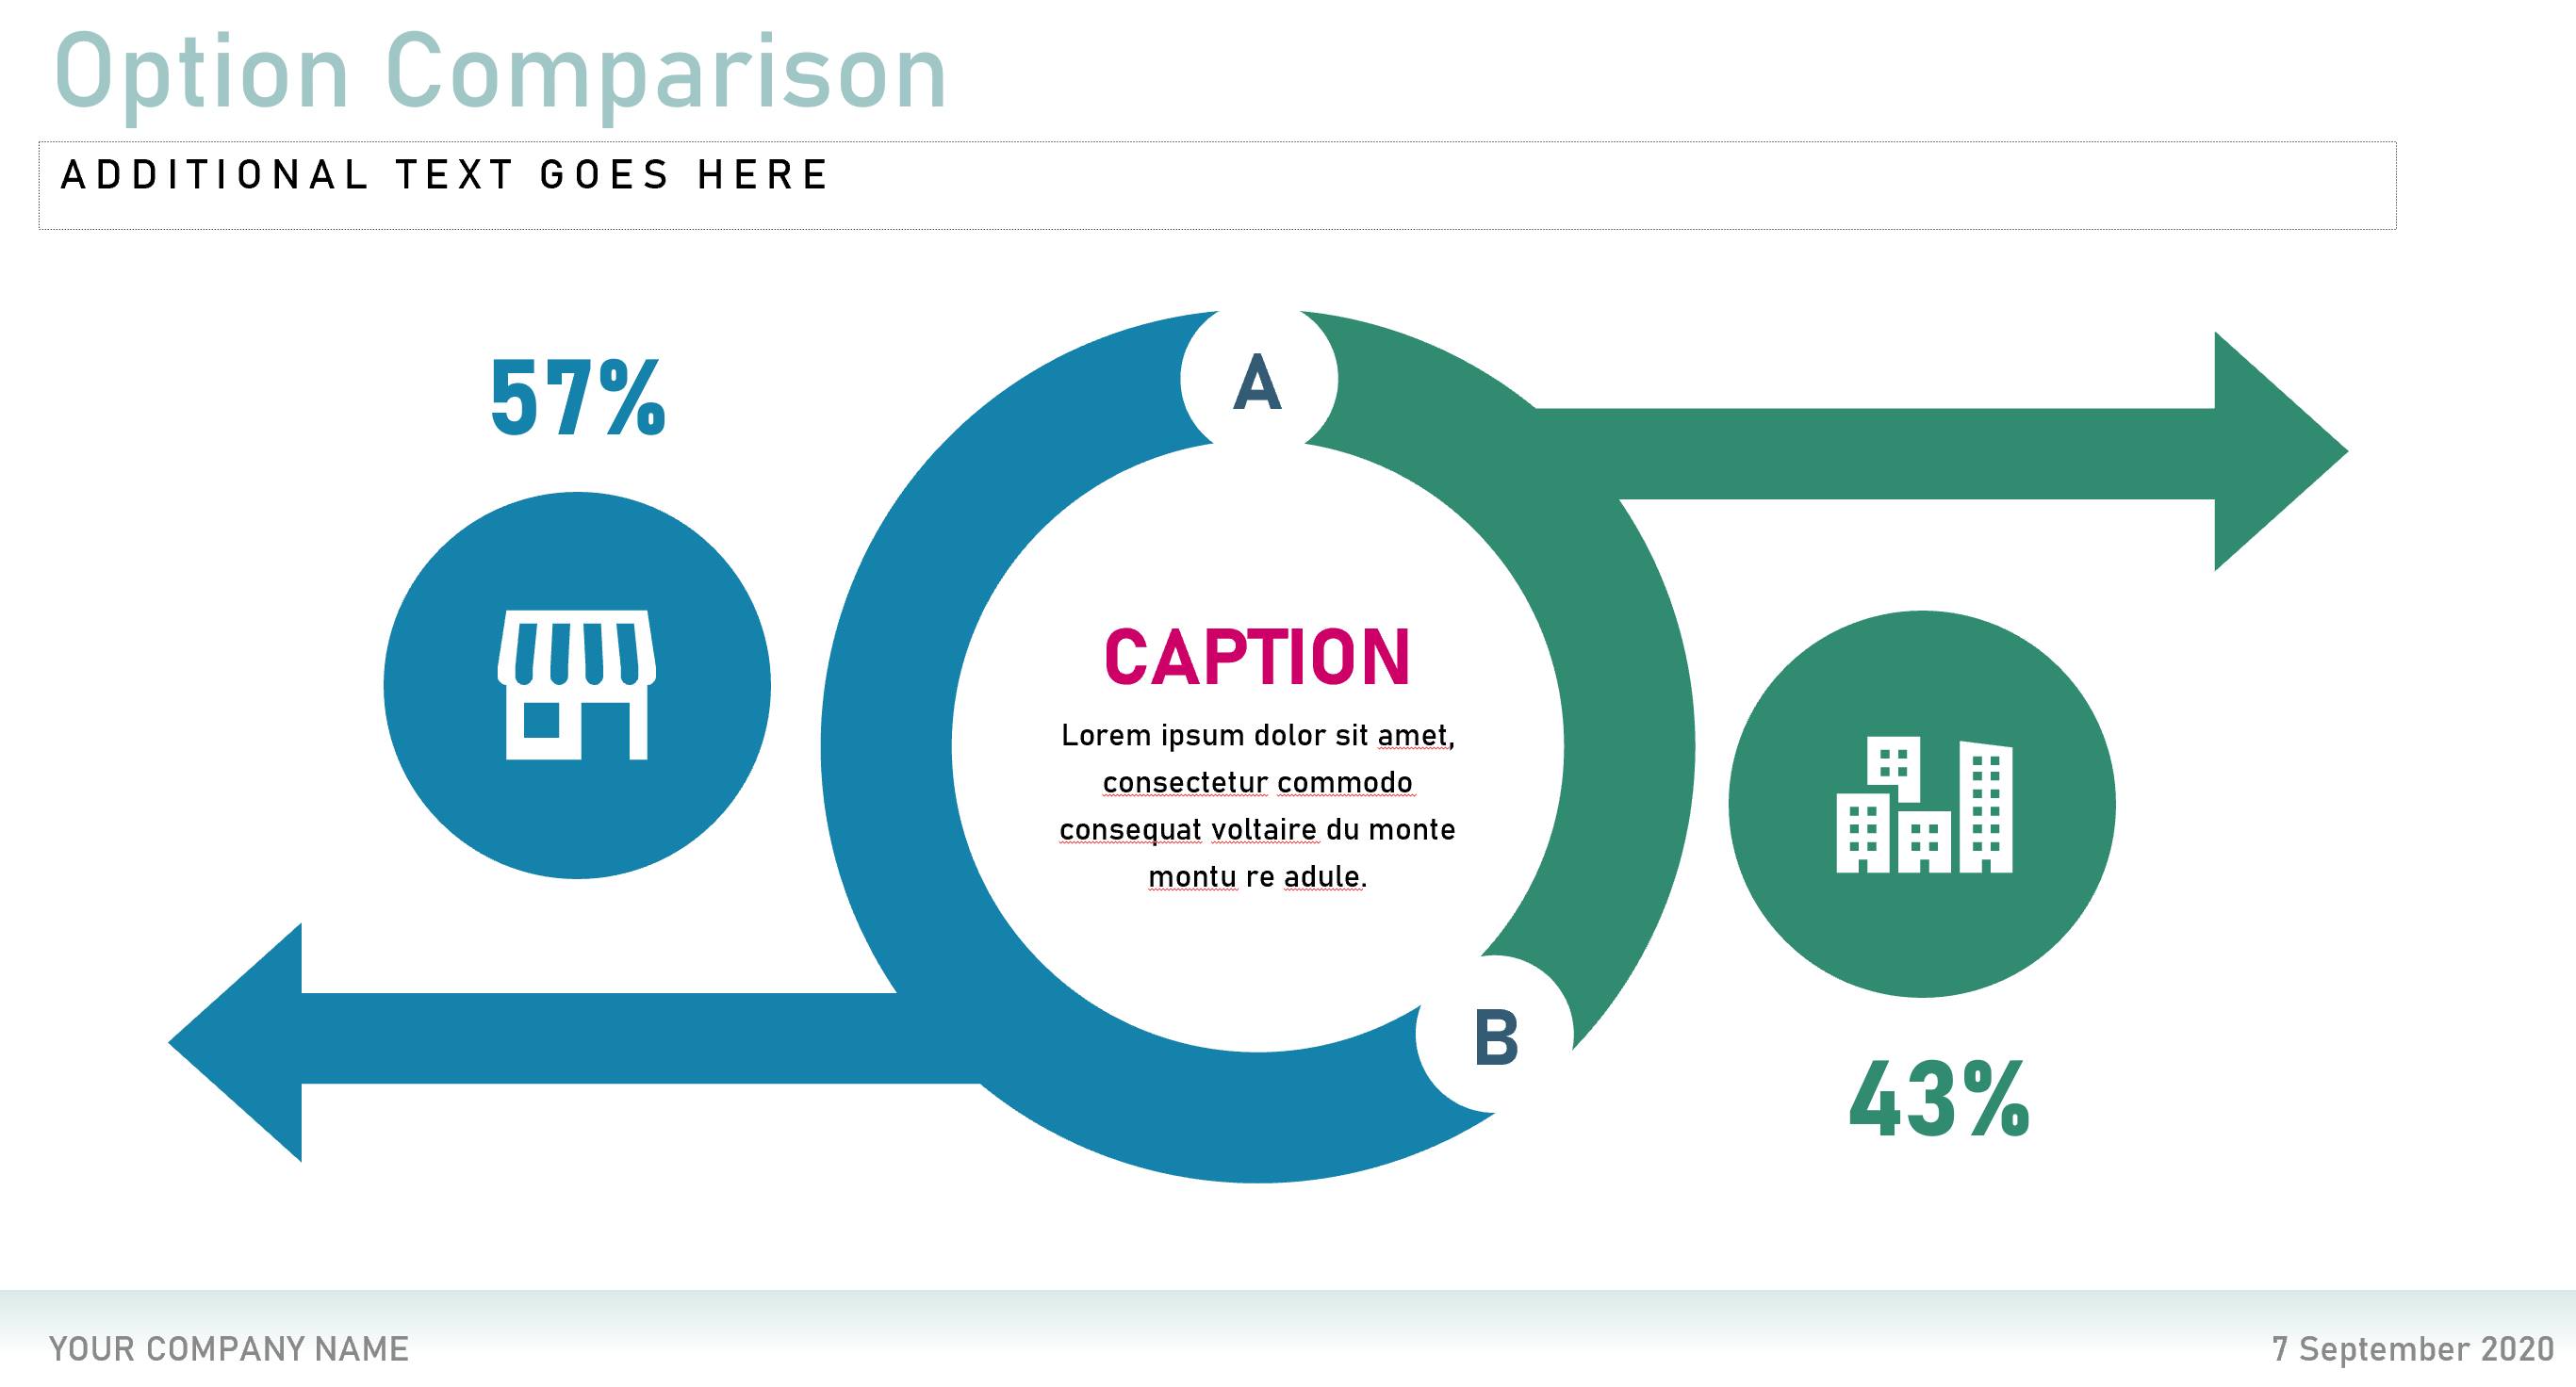
A comparison chart is a chart that draws a comparison between two or more items on based on different parameters related to the specific items. Use an editable diagram from the Comparison Charts Infographic presentation template to compare items in your proposal or presentation.
Excerpt:
Download
| File | Action |
|---|---|
| Data Visualisation Elements Comparison Charts Infographic Template.pptx | Download |
| Data Visualisation Elements Comparison Charts Infographic Template.gslides | Download |
- Version
- 42 Download
- 1.97 MB File Size
- 2 File Count
- May 15, 2020 Create Date
- September 16, 2020 Last Updated
- Templateguru.org Source
- Download

0 Comments