Business Concepts Pyramid Diagram Infographic Template
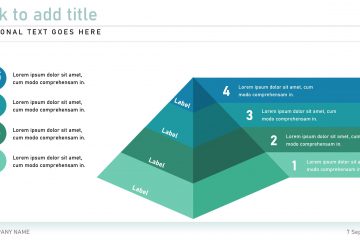
Visualise data in a hierarchical structure and depict foundation-based relationships in your business using editable diagrams from this Pyramid Diagram Infographic presentation template.
Visualise data in a hierarchical structure and depict foundation-based relationships in your business using editable diagrams from this Pyramid Diagram Infographic presentation template.
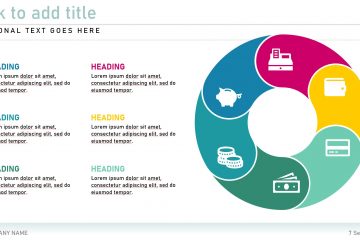
The fully editable Cycles Infographic presentation template was created to help you illustrate how different processes lead into and from one another to provide your business or project with a roadmap to success.
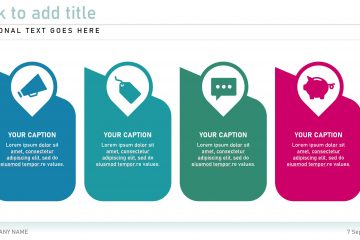
The Marketing Infographic presentation template contains a variety of marketing and advertising-related infographic elements for you to edit and add to your next marketing pitch.
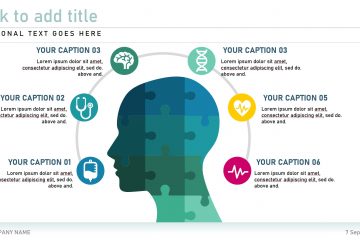
Use editable infographics from the General Infographic presentation template to add flair to your next health or medicine related proposal or presentation.
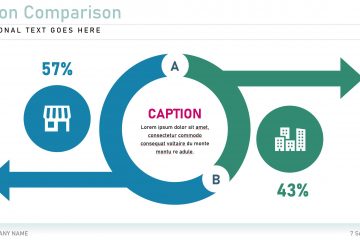
A comparison chart is a chart that draws a comparison between two or more items on based on different parameters related to the specific items. Use an editable diagram from the Comparison Charts Infographic presentation template to compare items in your proposal or presentation.
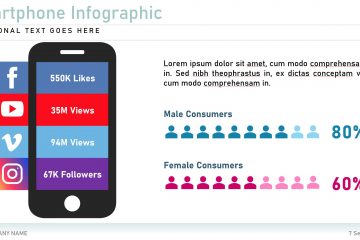
Facebook Twitter Youtube and more The Social Media Infographic presentation template contains social media-related infographic elements for you to edit and add to your next technology and communication or marketing pitch.
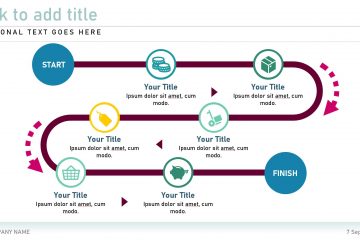
Find the right infographic elements to illustrate either the ongoing or the future route to success for your next project proposal or new business venture using editable elements from the Roadmap Infographic presentation template.
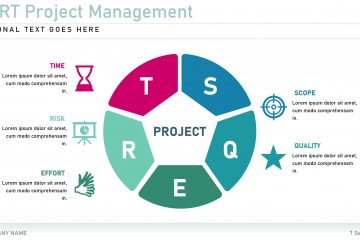
Project management is the way a person or business organises and manages resources that are necessary to complete a specific project. Use an editable diagram from the Project Management General presentation template to visually represent your own process.
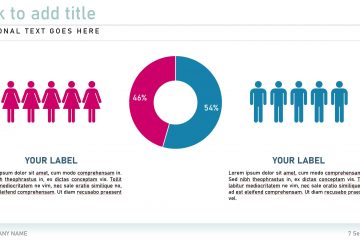
Pie charts are circular statistical graphics that are divided into slices to illustrate numerical proportion. The size of each ‘slice’ is proportional to the quantity it represents. Use an editable pie chart from the Pie Chart presentation template or draw inspiration from it to create your own.
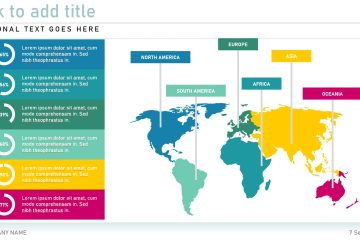
The World Maps Infographic presentation template contains several world map visuals that you can use to pinpoint specific locations or to add data to relevant areas on the map.