Products and Services Value Chain Template
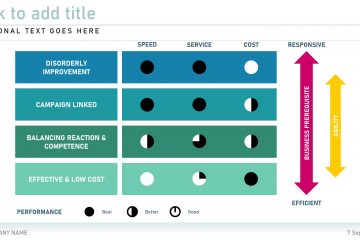
Illustrate the set of activities that your business performs in order to deliver a valuable product or service by using an editable diagram from the Value Chain presentation template.
Illustrate the set of activities that your business performs in order to deliver a valuable product or service by using an editable diagram from the Value Chain presentation template.
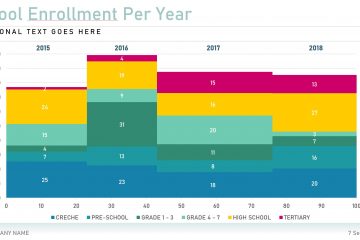
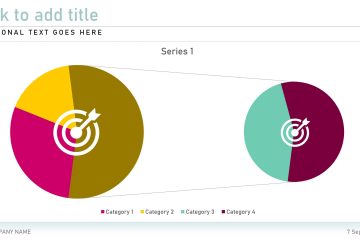
Use an editable diagram from the Mekko Chart presentation template to visualise categorical data over a pair of variables in your next business or project presentation. In a Mekko Chart both axes are variable with a percentage scale that determines both the width and height of each segment.
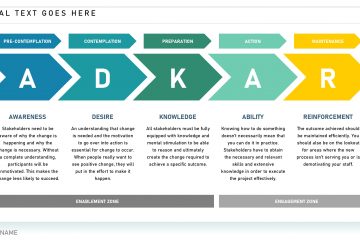
Use this editable ADKAR Business Concept presentation template to illustrate the five tangible and concrete outcomes that people need to achieve for lasting change: awareness desire knowledge ability and reinforcement.
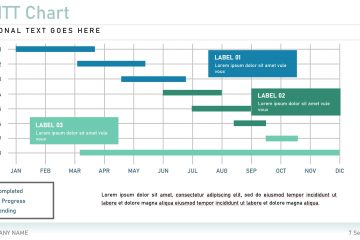
Gantt charts provide a graphical illustration of a schedule that helps to plan coordinate and monitor or track specific tasks in a project. Create yours by editing an existing diagram from the Gantt Chart presentation template.
The Diagram and Chart Varieties presentation template contains a variety of editable and inspirational diagrams and charts for you to customise and add to your next project or business proposal.
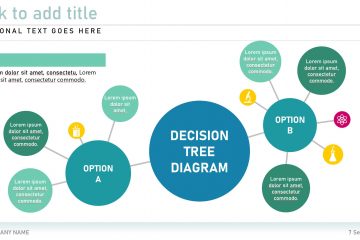
Decision trees are decision support tools that use a tree-like graph or model of decisions and their possible consequences including chance event outcomes resource costs and utility. Find your perfect editable problem-solving tree in the Decision Tree presentation template.
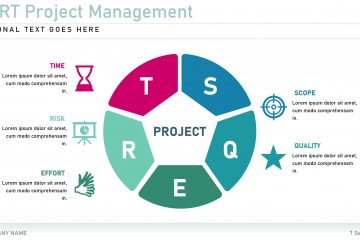
Project management is the way a person or business organises and manages resources that are necessary to complete a specific project. Use an editable diagram from the Project Management General presentation template to visually represent your own process.
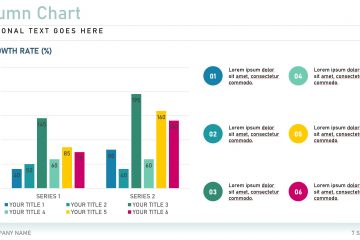
Use an editable bar graph or draw inspiration from the Bar Graph Statistics presentation template in order to illustrate comparisons between categories of data and information relevant to your business or project.
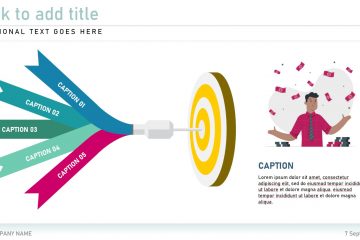
Reach your company’s goals and milestones by means of proper planning and communication. This fully editable Goals Infographic presentation template will help you to set realistic goals by the use of diagrams and and visual timelines.
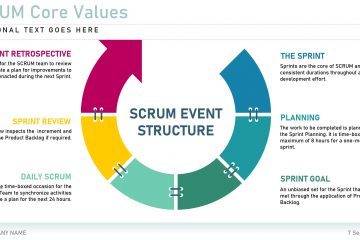
SCRUM is an agile approach to project management that breaks a product down into smaller tasks and places them on a list called a backlog. Tasks are taken from the backlog in the order they need to be completed and given to teams who work to get the job done Read more…