Business Concepts Business Plan Infographic Template
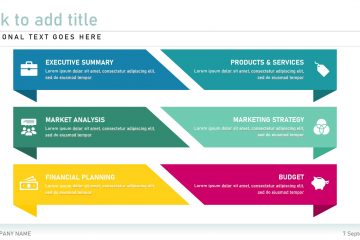
Communicate your dream to potential investors by making use of this editable Business Plan presentation template. Modify existing elements and charts to suit your individual needs.
Communicate your dream to potential investors by making use of this editable Business Plan presentation template. Modify existing elements and charts to suit your individual needs.
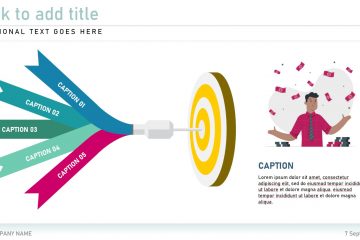
Reach your company’s goals and milestones by means of proper planning and communication. This fully editable Goals Infographic presentation template will help you to set realistic goals by the use of diagrams and and visual timelines.
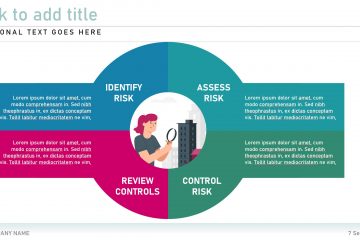
Risk management is the process of identifying assessing and controlling threats to an organisation’s capital and earnings. Visualise the proses in your next presentation by making use of a editable diagram or graphic from the Risk Management presentation template.
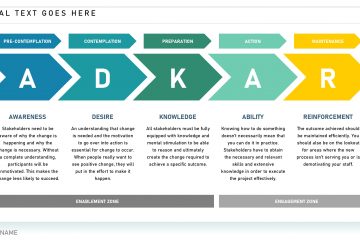
Use this editable ADKAR Business Concept presentation template to illustrate the five tangible and concrete outcomes that people need to achieve for lasting change: awareness desire knowledge ability and reinforcement.
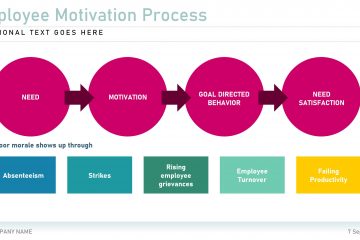
Effectively manage your company’s personnel and explore staff strengths and weaknesses by using elements and infographics from this fully editable Human Resources presentation template.
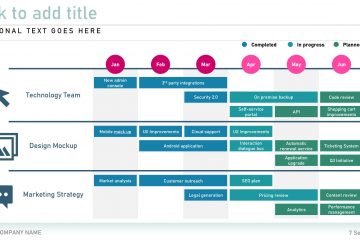
Edit a product roadmap diagram from the Product Roadmap presentation template to create a high-level visual summary that maps out the vision and direction of your product offering over time.
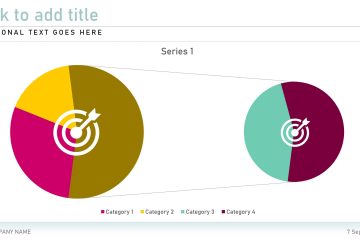
The Diagram and Chart Varieties presentation template contains a variety of editable and inspirational diagrams and charts for you to customise and add to your next project or business proposal.
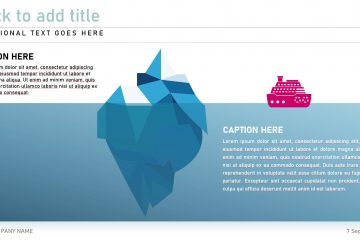
Use this editable Iceberg Business Concept presentation template is a multipurpose infographic to help you point out all the factors that are affecting your company. Start at the top of the iceberg with the most apparent factors and work your way down to the less apparent ones.
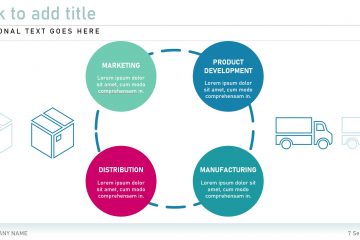
Use one of the Supply Chain presentation template’s editable diagrams to illustrate the network of all the individuals organisations resources activities and technology involved in the creation and eventual sale of a product.
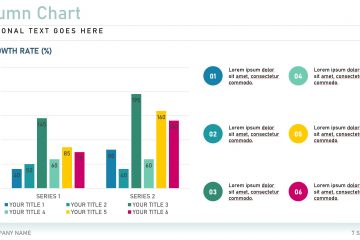
Use an editable bar graph or draw inspiration from the Bar Graph Statistics presentation template in order to illustrate comparisons between categories of data and information relevant to your business or project.